
Edge Observability 101: Tracking Latency, Routing, and QoE in Real Time
Track latency, routing, and QoE in real time with edge observability to improve network health and user experience.

You press play on a live match. The spinner twirls. Your friend next to you is already cheering. That tiny gap is your truth. Edge observability lives in that space, showing you why one screen sings while another stalls, and what to fix first so both feel instant.
Key Takeaways
- Measure what users feel first, then map it to network and server signals.
- Use RTT for path health and TTFB for server work; fix the path before tuning code if RTT is unstable.
- Analyze locally and forward selectively to keep edge logging lightweight and affordable.
- Tag everything with region, ISP ASN, device type, edge node, and cache state for fast, useful queries.
What Edge Observability Solves at the Last Mile
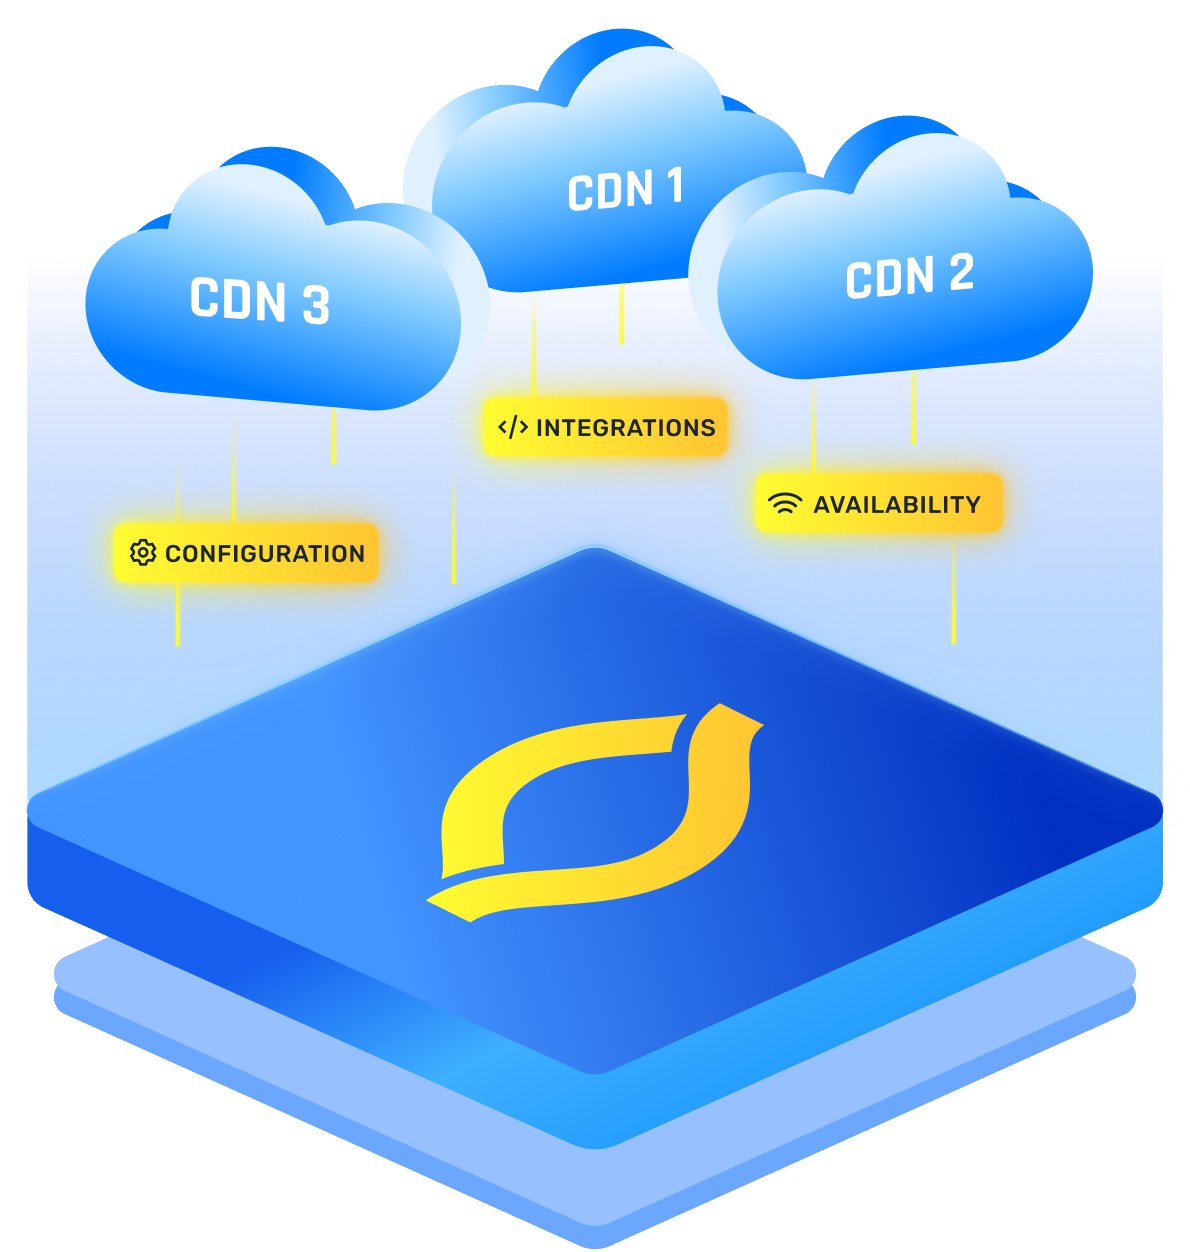
The edge is the place closest to your user or device. It can be a browser, a phone, a gateway in a store, a box on a factory floor, or a nearby point of presence. You push compute toward this edge to cut distance and cut delay. That move works, yet it also creates blind spots.
You need clear sight into the last mile, not only the data center. With edge observability, you see what users actually feel, not just what your core reports.
{{promo}}
Central Cloud vs Edge Observability
This shift is how you bring cloud native observability to the places where users live.
Monitoring vs Edge Observability
- Monitoring asks known questions. You set checks for known states.
- Observability lets you answer new questions from the signals you already gather.
You keep checks for safety. And add freedom to explore when things get weird.
- Metrics for fast trends and alerts
- Logs for exact events and deep context
- Traces for the path a single request took end to end
- Real user signals for what people actually felt on their devices
You will use all four, but will not always ship them all upstream. That is where smart edge monitoring keeps your app safe and your bills sane.
Cloud Native Observability Architecture at the Edge
Respect the limits on CPU, storage, and bandwidth at the edge. Your pattern is simple: analyze locally, forward selectively.
- Do light compute on the device or gateway
- Keep summaries for normal health
- Ship full traces and verbose edge logging only on error or anomaly
- Sync when links are good, buffer when links are weak
You protect your apps from heavy agents, control cost, and still keep the truth you need.
Edge Latency 101 for Real Time QoE
Keep three terms straight.
A big pipe can still feel slow if it is jammed. A small pipe can feel fast if it is clear.
Here’s how these latency components function:
You cannot beat physics, but you can shorten routes, remove queues, and speed up processing.
A simple latency formula you can use here is:
Transmission latency ≈ packet size in bits divided by link speed in bits per second.
Large payload on a slow link means a visible wait before the first byte even moves.
Using RTT and TTFB to Separate Network and Server Issues
- RTT measures network round trip only. Treat it as a path health check.
- TTFB measures time until the first byte of response arrives. It includes network plus server work.
Fast logic you can run
- Measure RTT from user vantage points to the target.
- If RTT is high or unstable, you have a path issue. Inspect hops.
- If RTT is fine but TTFB is high, the server or app is slow. Profile code and queries.
- If both are high, fix the path first. Then recheck the server.
This fork cuts long hunts and points you straight to the cause.
Causes of Edge Latency
You measure each part, then act on the part you control.
- Physical distance to the nearest healthy edge node
- Congestion in the last mile or at peering points
- Too many hops due to poor routing policy
- Overloaded edge servers with thin CPU or RAM
- Chatty code or slow database calls on the edge tier
- The medium itself, such as noisy Wi‑Fi or long satellite paths
Edge Monitoring Toolkit for Real Time Latency
You need two styles that work together.
- Active tests simulate traffic on purpose.
- Passive signals watch what real users do.
But, when it comes to tooling, you need to be extremely discreet:
Combining Synthetic Monitoring and Real User Monitoring
- Run synthetic checks from edge agents on a fixed schedule
- Collect real user timings in your pages and apps
- Compare baselines over time for both views
- Alert when both move together, or when users see pain but synthetics look fine
That last case often points to ISP trouble or device class issues.
Internet Routing and BGP for Edge Observability
The internet is a mesh of many networks called autonomous systems. BGP is how those networks share reachability and pick paths. The chosen path is shaped by policy and cost, not only by speed.
What this means for you: a user may be near your edge node, yet traffic can still take a scenic route. That adds delay and jitter you will not see by looking at servers alone.
- Run periodic traceroutes from multiple regions to each edge prefix
- Record autonomous system numbers on the path and watch for changes
- Mark where RTT jumps and match it to peering points
- Share proof with your ISP or CDN so they can adjust policy or add peering
You will not be guessing.
QoS vs QoE
QoS speaks about network health. QoE speaks about user happiness. You need both. When you talk with product or finance, lead with QoE, then back it with QoS.
How to Operationalize QoE Metrics
- Set guardrails per region and device class
- Tie each metric to an outcome you care about
- Put QoE on the top row of dashboards, QoS just below it
- Alert on deviations from baseline plus a minimum absolute threshold
You make it clear, and you make it actionable.
For streaming, and real-time apps, use these metrics for tracking:
Fixing a Slow Edge Region in Real Time
- Confirm the symptom with real user monitoring. Split by ISP and device group.
- Check RTT from synthetic agents in that region. Note jitter and loss.
- Run parallel traceroutes to the same edge node from two distant points. Compare paths.
- Inspect edge node CPU, memory, and queue depth.
- Fetch TTFB by route and cache hit state.
- If RTT spikes at one hop, open a ticket with exact hop data and time windows.
- If server load is high, shift traffic to a nearby node and warm caches.
- If TTFB is the only outlier with normal RTT, profile code paths and database calls on that node.
Solve the right problem in the right order.
How to Wire Telemetry for Edge Observability
- Use OpenTelemetry SDKs in services to produce metrics, logs, and traces
- Run a lightweight collector on the device or gateway
- Filter known noise, add tags like region and ISP, and batch data
- Forward summaries upstream on a fixed cadence
- On anomaly, forward rich logs and full traces for a short window
You gain detail when you need it and thrift when you do not.
Managed Edge Observability Platforms
Some teams want a product that bakes in the hard parts.
- NETSCOUT gives packet level clarity and strong synthetic probes
- Edge Delta pushes intelligence to the edge so you send less and learn more
Pick based on data gravity, data volume, and where your team wants to spend time.
{{promo}}
Automation Playbooks for Edge Observability
Vendors move faster when you show clear paths and clear impact.
Traffic steering with data
- Watch buffering ratio and TTFB per node
- When both degrade for a segment, shift that segment to a nearby node
- Warm caches ahead of the shift and confirm by QoE trend
ISP escalation with proof
- Detect RTT spikes tagged to one ASN
- Attach traceroute samples and time windows to the ticket
- Share impact in terms of startup time and exit before start for that ASN
Business Impact of Edge Observability
When you measure what users feel and tie it to action, you do more than fix outages. You raise retention, cut support load, and make launch days calm.
That is the promise when cloud native observability, careful edge monitoring, and disciplined edge logging work together.
Conclusion
Your user never sees your racks. They feel your seconds. With the right architecture, the right signals, and clear runbooks, you turn those seconds into wins.
The spinner stops. The match plays. Both screens cheer.
FAQs
What Is Edge Observability And How Is It Different From Monitoring?
Edge observability lets you answer new questions about user experience in real time using metrics, traces, edge logging, and real user data. Monitoring checks known states. Observability helps you debug unknown issues at the last mile. You still keep monitors, but you add freedom to explore when things go weird.
How Do I Measure Latency At The Edge In Real Time?
Use a mix of synthetic probes and real user monitoring. Run ping and traceroute from edge agents. Add one way tests for jitter and loss. Capture TTFB in the browser. Compare RTT and TTFB to split network vs server problems. Alert on baseline deviations per region and ISP.
How Can I See If BGP Or Routing Is Hurting My Users?
Schedule traceroutes from several regions to your edge prefixes. Record autonomous system paths and note where RTT jumps. Correlate with QoE and cache hit rate. If a single ASN keeps spiking, open a ticket with hop data and time windows. Ask your ISP or CDN to adjust policy.
What QoE Metrics Should I Track For Streaming Or Realtime Apps?
Track video startup time, buffering ratio, exit before start, average bitrate, failure rate, and engagement. Put these on the top row of dashboards. Tie each to a business outcome like watch time or conversion. Use them to drive traffic steering and capacity moves in your edge monitoring.
How Do I Control Cost For Edge Logging And Traces Without Losing Insight?
Analyze locally and forward selectively. Keep summaries upstream and burst rich traces only on anomaly. Sample by error, not by percentage. Rotate and compress logs on device. Adopt OpenTelemetry so you can swap backends without re instrumenting. This keeps cloud native observability flexible and cost aware.