
The Importance of Monitoring CDN Logs for Website Security
A CDN Log is a detailed record by Content Delivery Networks, crucial for website security, performance, and user insight optimization.


When push comes to shove in the online hemisphere, the security and performance of your website can hinge on something as seemingly mundane as CDN logs. These logs, generated by Content Delivery Networks (CDN), guide how content is delivered to your audience and how to protect your site from potential threats.
By monitoring these logs, you’re proactively safeguarding your online presence against the threats lurking in the cyber world. Neglecting CDN logs is the same as flying blind in the vast sky; you never know what’s approaching you.
What is a CDN Log?
A CDN Log is an extensive record produced by Content Delivery Networks (CDN), documenting various details about the requests processed and content delivered to users. These logs are treasure troves of data offering insights into how content is accessed and transferred across the internet through the CDN.

A CDN log tracks and records each request made to the CDN. This includes information about the user's IP address, the type of content requested (like images, videos, or web pages), the date and time of the request, the response status from the CDN (indicating whether the request was successful or not), and the amount of data transferred.
As we can see, CDN logs can provide details about the geographic location of the request, which browser or device was used, and the referring website or URL that directed the user to the content.
The Importance of CDN Log Monitoring
CDN Log Monitoring is an essential practice for maintaining and enhancing the health, performance, and security of a website.

It goes above and beyond in terms of value, and can candidly provide the following benefits:
1. Enhanced Security
- Early Detection of Threats: CDN logs are instrumental in identifying potential security threats at an early stage. For instance, a surge in traffic from a particular IP address or region, which is not in line with usual traffic patterns, can be an indicator of a cyber-attack in progress, such as a DDoS attack.
- Proactive Security Measures: Regular analysis of CDN logs can help in identifying vulnerabilities in your website’s security posture. By recognizing patterns that suggest malicious activities, you can take proactive measures to strengthen your defenses, such as updating firewall rules or enhancing authentication processes.
- Data Breach Investigation: In case of a data breach, CDN logs are essential for forensic analysis. They help in tracing the source of the breach and understanding the extent of the incident, which is critical for both remediation efforts and for reporting the breach in compliance with data protection laws.
2. Performance Optimization
- Identifying High Traffic Periods: CDN logs reveal the times when your website experiences the highest traffic. This information is vital for planning server scaling to handle increased loads, ensuring that your website remains responsive and efficient during peak times.
- Content Delivery Efficiency: By analyzing which content is requested most frequently, you can optimize the way content is cached and distributed across the CDN. This ensures faster load times and a better user experience.
- Geographical Performance Insights: CDN logs provide data on where your users are located. Understanding geographical patterns in content requests helps in optimizing the distribution of your content across various CDN nodes, ensuring that it is delivered from the closest possible location to the user, thus reducing latency.
3. Troubleshooting
- Error Identification: CDN logs record details about any errors encountered during content delivery. This includes HTTP error codes, which can indicate issues like broken links, inaccessible content, or server problems.
- Root Cause Analysis: The detailed information in CDN logs aids in conducting a thorough root cause analysis of issues. For example, if certain content is not being delivered correctly, logs can help determine whether the issue is related to server configuration, content caching, or network problems.
- User Experience Improvement: Regularly checking CDN logs for errors and addressing them promptly ensures that users have a smooth and uninterrupted experience on your website. This proactive approach to problem-solving helps maintain and improve the reputation of your site.
4. User Behavior Insights
- Understanding User Preferences: CDN logs offer a window into the types of content that users find most appealing. By identifying the most frequently accessed files, you can gain insights into user preferences, helping to tailor your content more effectively to your audience's interests.
- Refining Marketing Strategies: Analysis of user behavior through CDN logs can significantly enhance marketing efforts. For instance, understanding peak access times and popular content can help in scheduling marketing campaigns more effectively, ensuring that promotional materials are released when they are most likely to be seen by your target audience.
5. Compliance and Auditing
- Regulatory Compliance: Many industries are subject to stringent regulatory requirements regarding data handling and user privacy. CDN logs provide a comprehensive record of data transactions, including what content was accessed, when, and by whom, which is crucial for demonstrating compliance with these regulations.
- Audit Trails: CDN logs serve as an audit trail for all content delivery activities. In the event of an audit, these logs can be reviewed to verify that all operations were carried out in accordance with the prescribed standards and policies.
6. Bandwidth Management
- Identifying Bandwidth Usage Patterns: CDN logs provide detailed information about bandwidth usage, including which content consumes the most bandwidth. This helps in identifying usage patterns and peak bandwidth demands.
- Cost Optimization: By understanding these patterns, you can optimize your bandwidth allocation, potentially lowering costs. For example, you might realize that certain large files are seldom accessed and decide to compress them or remove them altogether.
- Resource Allocation: Insight into bandwidth usage can also inform decisions about resource allocation. For instance, if you know that certain times of day require more bandwidth, you can plan accordingly to ensure that your site remains responsive and efficient.
- Efficient Content Delivery: Analyzing bandwidth usage can also help in making decisions about how to structure content delivery. For example, you might choose to implement more aggressive caching strategies for high-demand content to reduce bandwidth consumption.
Types of CDN Logs
Not all CDN logs are created equal. Knowing what each stream captures makes analysis faster and decisions clearer.
The categories below appear under different names across vendors, but they map to similar concepts.
- Request and response logs
Per request details such as timestamp, client IP, host, path, status code, bytes, TLS version, protocol, and cache status. Useful for performance, caching, security, and troubleshooting. - Cache activity logs
Cache hit or miss, revalidation, TTL, stale serve, and purge events. These explain origin load and user latency, and help tune TTLs and cache keys. - Edge security logs
WAF actions, bot detections, rate limiting, and custom rules at the edge. These reveal credential stuffing, scraping, and exploit attempts. - Edge compute and worker logs
Output from edge functions that rewrite URLs, set headers, or route traffic. These are critical when logic runs at the edge before the origin. - Origin fetch logs
Attempts to reach the origin, including origin status, latency, and retries. These separate origin problems from edge issues. - Delivery error logs
Aggregated reports of 4xx and 5xx spikes, protocol negotiation failures, handshake errors, and timeouts. These guide incident response. - DNS and routing logs
Resolution results, POP selection, and failover events. These help diagnose regional performance and availability shifts.
Tools And Best Practices For Effective CDN Log Monitoring
Effective CDN monitoring blends the right tooling with clear processes. This section outlines practical options for collection, enrichment, visualization, alerting, and continuous improvement across single and multi CDN setups.
Overview Of Common Tools Used For Log Collection And Analysis
The table below maps common categories to example tools and how they fit together in a typical pipeline.
Use this matrix to assemble a stack that matches your volume, skills, and budget, then standardize schemas so metrics remain comparable across vendors.
How To Automate Anomaly Detection
Automation reduces time to detect and surfaces subtle regressions that humans miss. Start with a clear picture of normal behavior and then create focused detectors.
- Define baselines per path, geography, and POP so seasonal and regional patterns are captured.
- Engineer signals such as cache hit ratio deltas, p95 and p99 TTFB, 4xx and 5xx rates, and POST density to sensitive endpoints.
- Apply statistical or ML detectors such as z score windows, EWMA, and seasonal decomposition to isolate real change.
- Route alerts with severity that reflects user impact and include top exemplars such as paths, ASNs, and user agents.
- Build a feedback loop so operators can mark alerts as good or noisy to improve thresholds over time.
With these steps, alerts become actionable and noise falls, which improves trust in the monitoring system.
Benefits Of Visual Dashboards For CDN Health
Dashboards make complex edge behavior understandable at a glance. They should answer what is normal, what is broken, and who must act.
- Overview tiles for cache hit ratio, edge TTFB percentiles, and origin error rate by region.
- Flow visuals showing request count from user region to POP to origin for quick bottleneck spotting.
- Breakouts by ASN and device class to separate residential users from hosting providers and bots.
- Path level leaders for heavy bandwidth assets and frequent cache misses to guide optimization.
- Drillthrough links to raw logs with prefilled filters for fast incident triage.
A well curated dashboard shortens the path from detection to decision and helps teams align on priorities.
Core Components of CDN Log Monitoring

A CDN Log is highly customizable, and can contain a multitude of data points. However, across a multitude of CDN vendors, the following metrics are known to be consistent:
1. Request Details
- Request Method: This indicates the HTTP method used for the request, such as GET, POST, PUT, or DELETE. Understanding the request method is important for determining the nature of the request, whether it's fetching data, submitting a form, updating content, or removing data.
- HTTP Protocol Version: The version of the HTTP protocol (e.g., HTTP/1.1, HTTP/2) used for the request can be logged. This is important for compatibility and performance reasons, as different versions have different capabilities and efficiency levels.
- Requested URL: The specific Uniform Resource Locator (URL) requested, which might include query strings or parameters. This detailed URL logging helps in understanding exactly what content or page is being accessed.
- Request Size: The size of the request itself, often in bytes, which includes the request headers and body (if present). This can be important for analyzing the overhead caused by the request headers and optimizing them.
- TLS/SSL Information: If the request is made over HTTPS, details about the TLS (Transport Layer Security) or SSL (Secure Sockets Layer) version, and the cipher used can be included. This is vital for ensuring that secure, encrypted connections are being used and are up to date with current standards.
- Session Identifiers: If the CDN supports sessions, identifiers such as cookies or session tokens might be logged. This is crucial for tracking user sessions and understanding user behavior over multiple requests.
- Hostname Requested: The specific hostname (or subdomain) that the request was made to. This is particularly important for CDNs serving multiple websites or applications, as it identifies which site the request pertains to.
- Port Number: The port number used for the request can also be logged, indicating whether standard web ports (like 80 for HTTP and 443 for HTTPS) or other custom ports were used.
2. Response Status Codes
These codes are part of the HTTP standard and give a quick, standardized way to understand how the server responded to a request.
Each status code falls into different categories, represented by the first digit, and provides specific insights.
3. User Agent Details
This provides insight into the devices and software used by visitors to access content through the CDN. This information is gleaned from the "User-Agent" header in the HTTP request, which is sent by the client (typically a web browser or a mobile app) to the server.
The User-Agent string typically includes:
- Browser Information
- Operating System
- Device Type
- Rendering Engine
- Language Preference
- Other Software Details
{{promo}}
4. Cache Performance Data
This data revolves around how content is stored and retrieved in the CDN's cache, playing a significant role in content delivery speed and overall website performance.
Here is what it usually includes:
- Cache Hit or Cache Miss: One of the primary elements of cache performance data is the distinction between cache hits and misses. A cache hit occurs when the requested content is found in the CDN's cache, allowing for swift delivery. Conversely, a cache miss means the content is not in the cache, necessitating retrieval from the original server, which is slower. Monitoring the ratio of hits to misses is crucial for assessing the efficiency of the cache configuration.
- Cache Freshness: This refers to how current or "fresh" the content in the cache is. CDN logs can show the age of cached content, indicating when it was last updated. Ensuring that the content in the cache is up-to-date is vital for delivering relevant and accurate information to users.
- Time-to-Live (TTL) Values: TTL settings determine how long content stays in the cache before it’s considered stale and needs to be refreshed. CDN logs can provide data on these TTL values and how they impact cache performance. Optimizing TTL settings is a balancing act between reducing load on the origin server and ensuring content freshness.
- Geographic Distribution of Cache Requests: Since CDNs are distributed across various locations, cache performance can vary regionally. CDN logs can provide data on cache hit and miss rates in different geographic areas, highlighting the need for regional optimizations.
- Cacheable vs. Non-Cacheable Content: CDN logs can differentiate between cacheable and non-cacheable content, helping you to identify opportunities to increase the cacheability of your content.
Importance Of Real Time Monitoring Versus Periodic Audits
Both approaches matter and they serve different goals. The table summarizes where each excels so you can invest appropriately.
- Use real time monitoring for user impacting issues and security signals.
- Schedule audits to tune caching, reduce egress, and validate compliance.
- Combine both to balance speed of response with structural improvements.
Blending live guards with periodic reviews gives resilience without runaway cost.
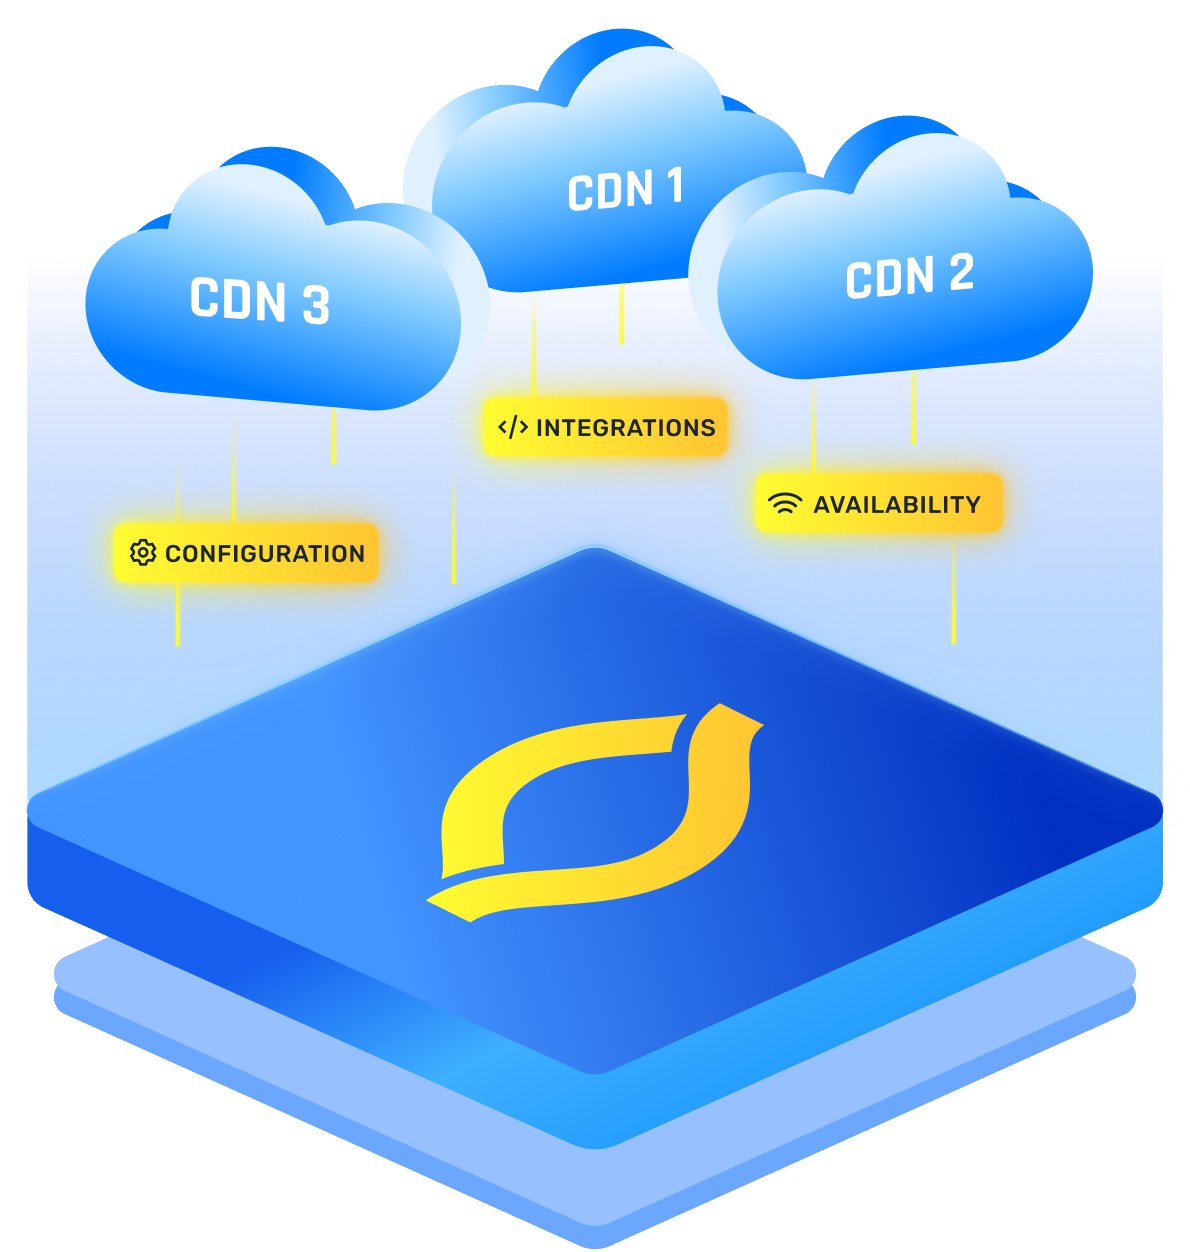
How IO River Simplifies Log Access For Multi CDN Environments
Multi CDN increases reach and resilience but complicates observability. IO River helps by centralizing access and normalizing signals so teams can compare apples to apples and gain maximum CDN performance.
- Unified log access across providers with a consistent schema for cache status, POP, and protocol.
- Single API or sink configuration so shippers and SIEMs do not need per vendor adapters.
- Real time streams and historical retrieval with filters for domain, region, and path.
- Role based access and retention policies to align with security and compliance requirements.
- Built in health views that correlate performance and errors across all active CDNs.
- Allows you to find which CDN has the most reliable uptime for your exact audience.
This consolidation reduces integration work and speeds up both troubleshooting and reporting with zero downtime deployment as an added bonus.
Conclusion
In essence, through leveraging the wealth of information contained in these logs, you can not only safeguard your online presence but also elevate it, ensuring that your digital offerings are secure, fast, and aligned with user needs.
FAQs
Why Should CDN Logs Be Monitored In Real Time?
Real time monitoring lets you spot incidents while they are still small. Spikes in 4xx or 5xx errors, sudden cache miss surges, or unusual geographies can reveal attacks and outages. Early alerts shorten mean time to detect and mean time to mitigate, which protects revenue and user experience.
How Do CDN Logs Help Detect Cyberattacks?
Patterns in CDN logs expose hostile behavior. Repeated login attempts, elevated POST rates, bursts of 401 or 429 responses, and traffic concentrated from a single ASN or region can indicate credential stuffing or DDoS activity. Combining user agent, referrer, and path anomalies improves confidence and reduces false positives.
Which Metrics Matter Most In CDN Performance Monitoring?
Track cache hit ratio by path, p95 and p99 time to first byte at the edge, origin latency, request error rates, and protocol distribution across HTTP versions. Break these down by geography, ASN, and device type. Focus on distributions rather than averages, since tail latency drives user experience.
Can Log Monitoring Reduce CDN Costs?
Yes. Logs reveal low value traffic and cache misses that waste bandwidth. Identify large assets with poor cacheability, hotlinking sources, and noisy bots. Tighten caching rules, enable stale content strategies, compress or segment heavy media, and block abusers. These actions cut egress, shrink origin load, and lower invoices.
What Is The Best Way To Check If A CDN Is Working Properly?
Start with a health dashboard that shows cache hit ratio, edge TTFB percentiles, error rates, and regional traffic. Correlate real time alerts with synthetic CDN checks targeting key paths. Validate signed URLs, TLS versions, and redirects. Confirm that origin load is stable and that logs show expected protocol adoption.